The Funding Rate Almanac: What Five Years of Perp Carry Actually Paid

The Fluxy Team
-The Funding Rate Almanac: What Five Years of Perp Carry Actually Paid
Funding rates are crypto's most talked-about, least measured yield. Everyone quotes the mechanism — longs pay shorts when the perp trades rich — and everyone has an anecdote about 2021. What's rare is the actual ledger: what would systematically collecting funding have paid, year by year, venue by venue, with the losing stretches included?
We have the data to answer that. Our platform's market database ingests settlement-level funding prints as they happen, and it has been doing so for years. This study uses roughly 80,000 settlement prints across Binance USDS-M (Dec 2019 → Aug 2026, 8-hour settlements), Hyperliquid (May 2023 → Aug 2026, hourly), and KuCoin Futures (Jan 2022 → Aug 2026, 8-hour), for BTC and ETH perps. Every number below is the sum of actual settlements — no interpolation, no vendor aggregates.
Finding 1: funding is a regime, not a rate
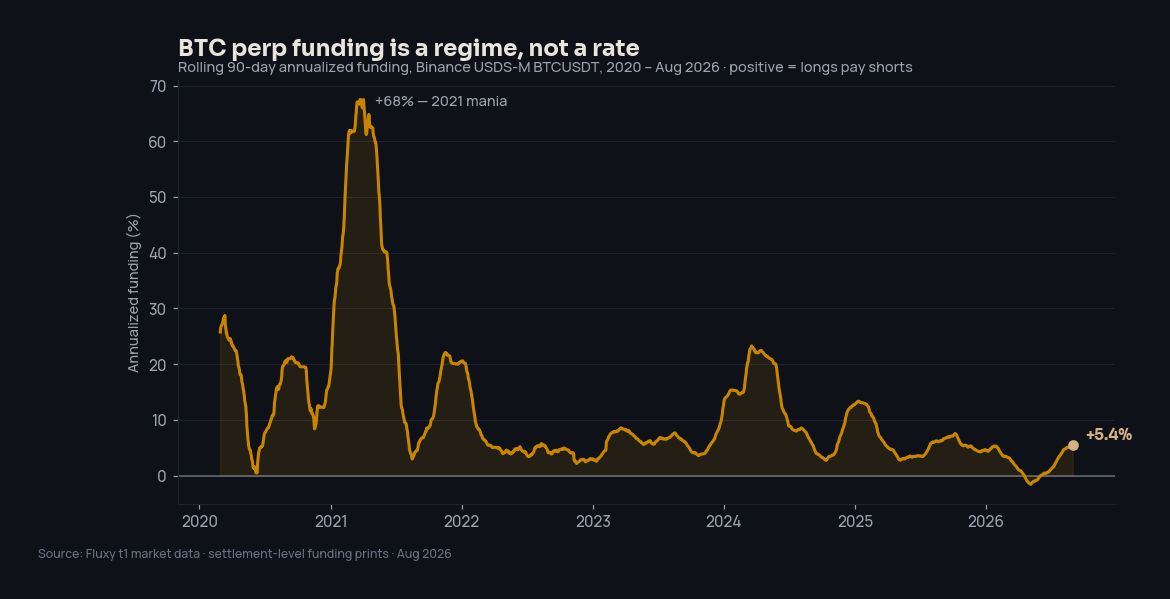
The rolling 90-day annualized funding rate for BTC on Binance has spent the last five years everywhere between −2% and +68%. Quoting "the funding yield" as a single number is meaningless — the honest description is a regime series: euphoric stretches where longs pay astonishing rents (the 2021 peak annualized near +68%; early 2024 revisited +23%), long unglamorous stretches in the mid single digits, and brief sharp inversions when crashes flip the book (March 2020, November 2022).
As of August 2026, the 90-day figure sits around +5% — the quiet end of the historical range.
Finding 2: what a year of collecting actually paid
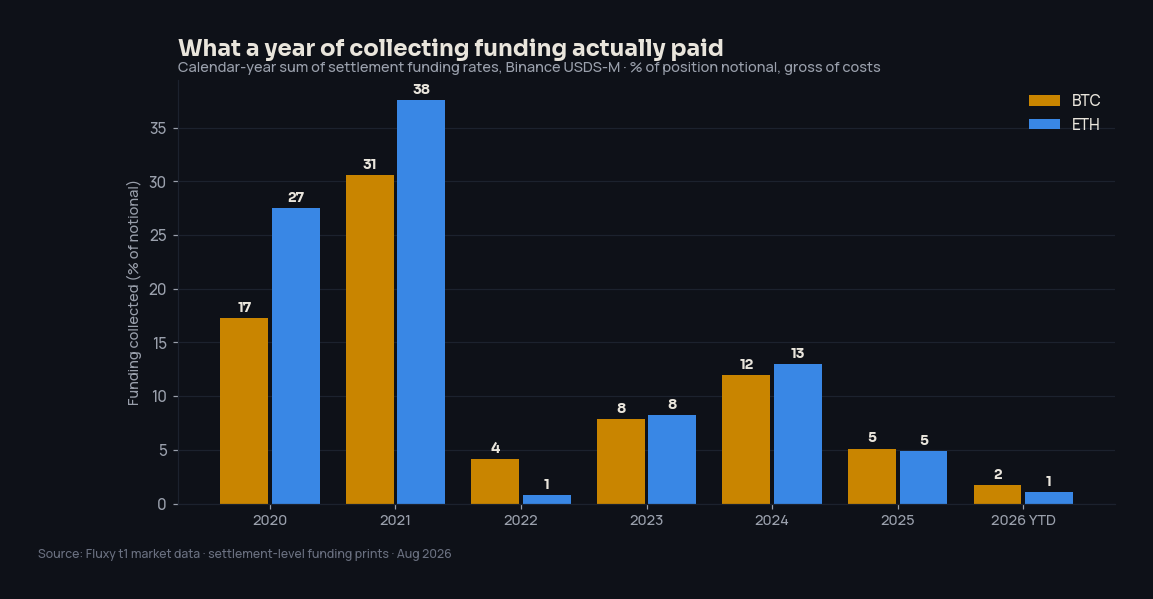
Summing every settlement in each calendar year gives the gross return a constant short-perp position would have collected in funding, as a percentage of notional:
| Year | BTC | ETH | |------|-----|-----| | 2020 | +17.2% | +27.5% | | 2021 | +30.6% | +37.5% | | 2022 | +4.2% | +0.8% | | 2023 | +7.9% | +8.3% | | 2024 | +12.0% | +13.0% | | 2025 | +5.1% | +4.9% | | 2026 (Jan–Aug) | +1.7% | +1.0% |
Two things are true at once. The carry is real: funding printed positive on ~86% of all Binance settlements in the sample, and every full year in it was net positive. And the carry is shrinking: the 2020–2021 numbers were a market inefficiency being arbitraged in real time, and the post-2022 normal is mid-single-digits with occasional double-digit years when a bull regime returns. Anyone selling you "20% passive yield from funding" is quoting 2021.
Finding 3: the same trade pays double on one venue
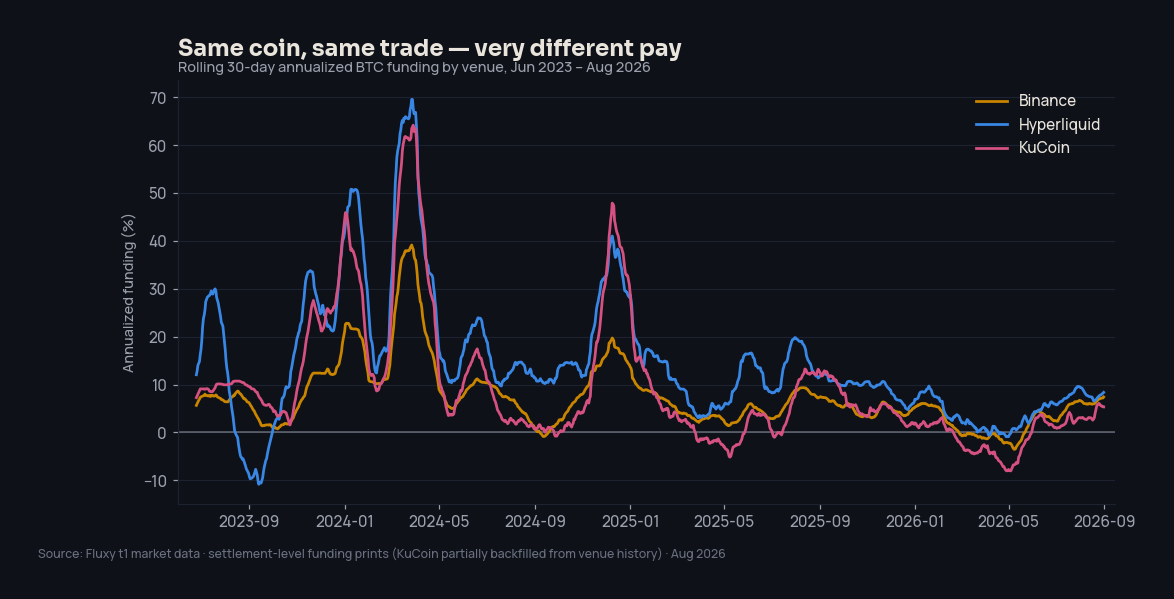
This is the finding we haven't seen published anywhere. Over the common window since June 2023, annualized BTC funding was:
| Venue | Annualized funding | |-------|--------------------| | Hyperliquid | +14.5% | | KuCoin Futures | +9.4% | | Binance | +7.3% |
Hyperliquid's rolling 30-day funding exceeded Binance's on 95% of days, with a mean gap of +7.3 percentage points. The direction is intuitive — a newer venue with leveraged-long-heavy flow and an hourly settlement mechanism prices its perp richer more often — but the size and persistence of the gap is the story. It means where you collect the carry matters as much as whether you collect it, and it's why a cross-venue funding book (short the rich venue, long the cheap one) exists as a strategy at all: on this sample it earned the spread while staying price-neutral.
(One methodology note: our KuCoin scrape originally had a gap from September 2025 to May 2026. We backfilled it from the venue's own funding-history API — roughly 300,000 settlement prints — before computing these figures. Instructively, the covered-days-only number had been 11.8%: the gap happened to span a low-and-negative funding stretch, which is exactly the kind of silent flattery missing data produces.)
Finding 4: the tails are a day's work
The worst single funding day in the sample was March 13, 2020 — the COVID crash — when a short-BTC-perp position paid 0.38% of notional in one day as funding inverted hard. November 10, 2022 (FTX) cost 0.26%. The best day, February 12, 2020, collected +0.51%. These tails are why funding strategies are position-managed, not fire-and-forget: the average is kind, and the worst week arrives precisely when everything else in crypto is also on fire.
Methodology, and what this is not
Sums of settlement rates measure gross funding on constant notional. They exclude trading fees, slippage, the cost and basis risk of the hedge leg, and the operational risk of running the position — a real carry book earns meaningfully less than these gross figures, and can lose money in an inversion even when the year sums positive. This is a measurement of the raw material, not a track record, and it is not investment advice.
It's also, incidentally, why our backtesting engine charges funding at each venue's real settlement times instead of treating it as a footnote: on the evidence above, funding is the P&L for a whole family of strategies, and an engine that models it loosely is testing fiction. If you want to research a carry or basis strategy against this same settlement-level data, that's exactly what the platform is for.
Backtest carry and basis strategies against the same settlement-level funding data this study is built on. Explore the backtesting engine →
Related reading